N Axis
0
0
Edited Aug 31, 2015
The N Axis is mainly used to enable the viewing of N sizes1 next to results. It isn't as useful if all your measures are computed from the same variable, and would thus all have the same N size. It is useful if your measures come from multiple variables with potentially different N sizes.
1 By "N size" we are referring to a count of the non-missing values used to compute a result. The term "Valid Count" is often used to mean the same thing.
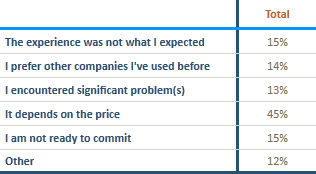
Let's start out with a table of measures as shown in figure 1.0.
figure 1.0
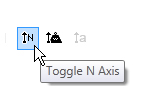
To use the N Axis, click the 'Toggle N Axis' button as shown in figure 1.1. This button is located on the toolbar near the middle-left side.
figure 1.1
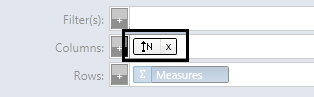
Clicking the 'Toggle N Axis' button will cause the N Axis Box to appear in (or hide from) the Series/Columns Container as shown in figure 1.2:
figure 1.2
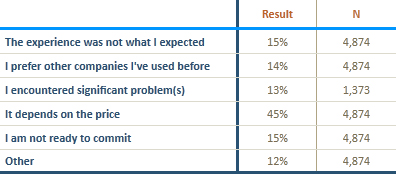
With the N Axis Box present in the Series/Columns Container, your table will now look something like this:
figure 1.3
For increased functionality, click the N Axis Box (the Box, not the Button -- see figure 1.2 above) to edit the Axis. A window will open which
allows you to re-label each header. You may also click the checkboxes to toggle the display of Result, Unweighted N, and Weighted N.
figure 1.4
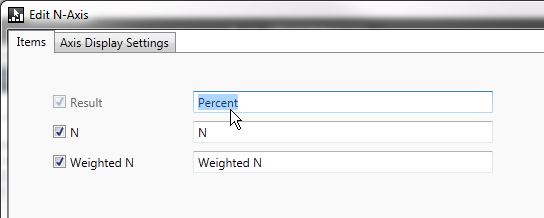
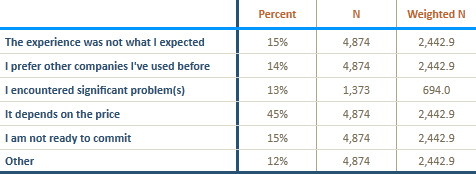
In this example I've re-labeled the Result column to "Percent" and I've specified that I would also like to display Weighted N. The Axis settings are shown above in figure 1.4 and the corresponding output table is shown below in figure 1.5.
figure 1.5
The N Axis works like any other Axis. So it is possible to drag it into the Rows container and/or combine it with other Axes for a highly customized result.
