
Use Header Lines and Footer Lines to include a little extra information at the top and bottom of your tables and charts in Excel. At the top you might want to include the table #, title, and a note about the base. At the bottom you might want to include notes about statistical testing. But these notes are totally custom, so you can include other information too.
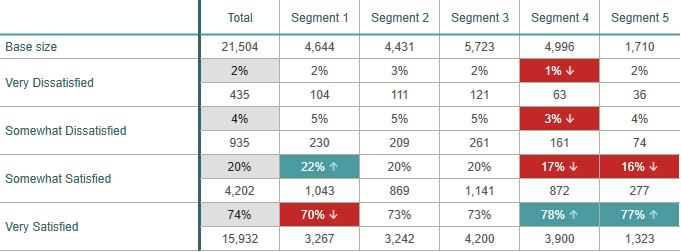
Starting with a basic table:
Add a title. Switch to the title tab and click "AUTO>". This will will populate the title textbox by extracting variable labels from the table’s measures.
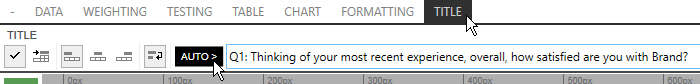
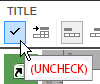
The auto button also automatically checks the 'show title' checkbox. But showing a title in this way is better suited for PowerPoint. In Excel, I recommend unchecking that box.
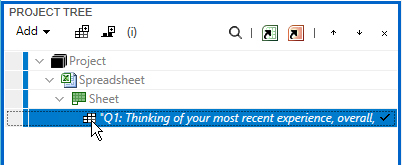
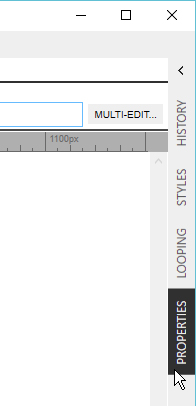
With your table selected in the project tree...
... open the Properties pane (on the right side of the window).
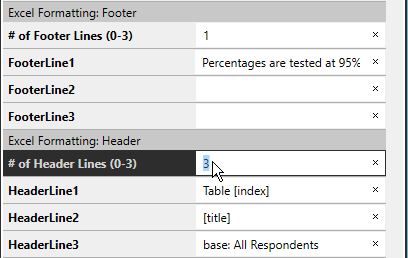
You’ll see a section for Header Lines. First, type the number of Header Lines you wish to include. Next, type some text for each headerline. There’s also a section for Footer Lines. Try the text and values shown here.
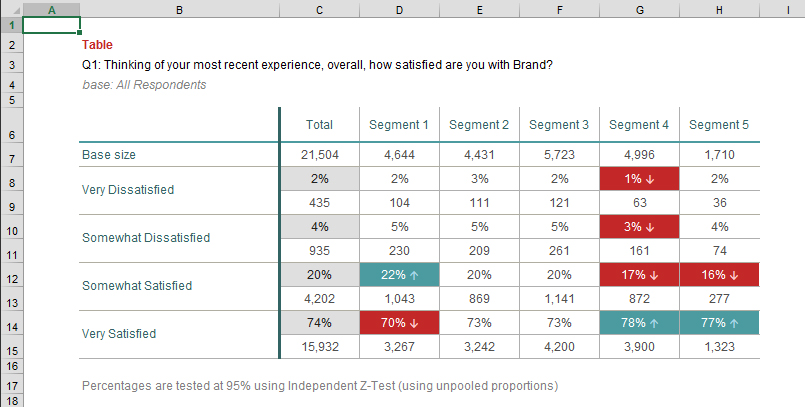
The preview window doesn’t show anything differently, but when you export to Excel, the headerlines and footerlines appear.
Notice that HeaderLine1 includes the keyword “[index]”. If I want to use indexing, I must do two things:
Set Index Me to true:
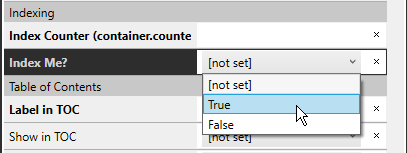
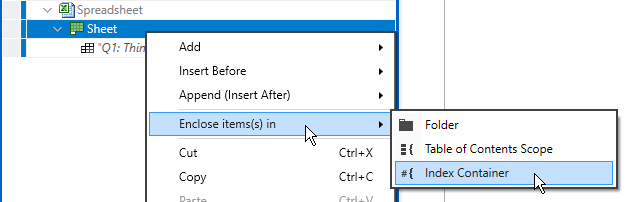
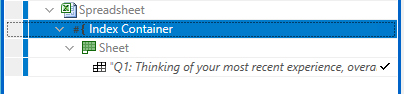
Create an index container. Everything inside the index container will be given an index, starting at 1.
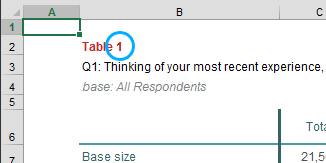
Now the index will appear in the HeaderLine which uses the [index] keyword:
For more information on indexing, such as how to use multiple counters for charts vs. tables, click here.
For information on including tables in a table of contents, click here.
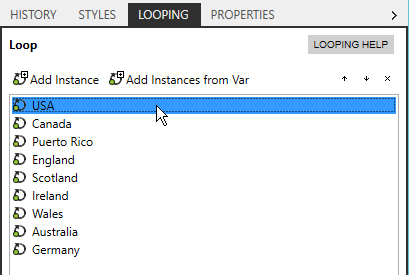
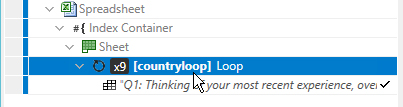
If your table is contained in a loop, you may want to use the labels from the loop instances in your Header Lines. In this example the loop has 9 instances.
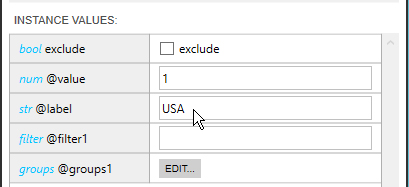
Clicking on an instance in the Looping pane allows me to view/edit the instance values:
@label is defined for each instance.
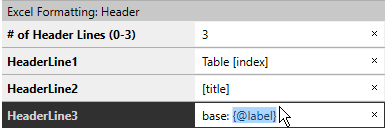
In the Property pane, change HeaderLine3 to include {@label}. (The curly braces tell Report Builder to execute the syntax inside them. And @label is syntax that returns a string).
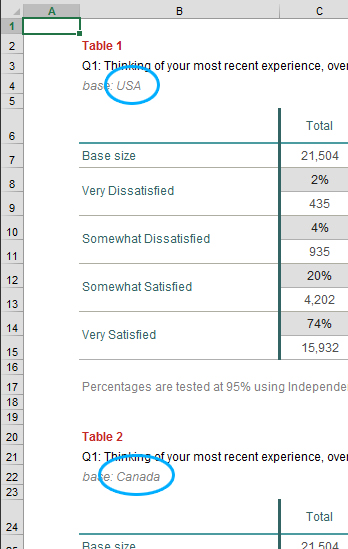
Now the exported 3rd header line will include the instance label.
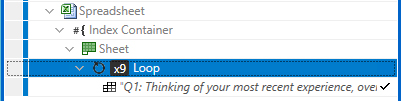
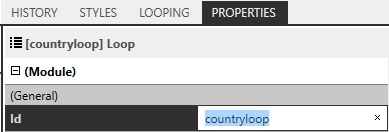
It's best to give your loop an id. The id appears in square brackets [] in the project tree. To give your loop an id, select the loop in the project tree:
Then use the Properties pane to provide the id. Your id cannot contain spaces or special characters. If your id doesn't immediately appear in [brackets] in the project tree, just collapse and re-expand the loop and it will appear. (That will be fixed in a future release).
Now, make the syntax in HeaderLine3 more specific by referring to the loop id. Change {@label} to {@countryloop.label}.
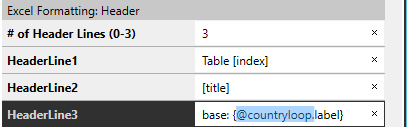
Using an id allows you to have multiple nested loops and refer to each individually.
For more information on looping click here.