Design, Program, Connect
Drive visuals with data. Program constraints, conditional visibility, looping. Configure visual elements with exactness.
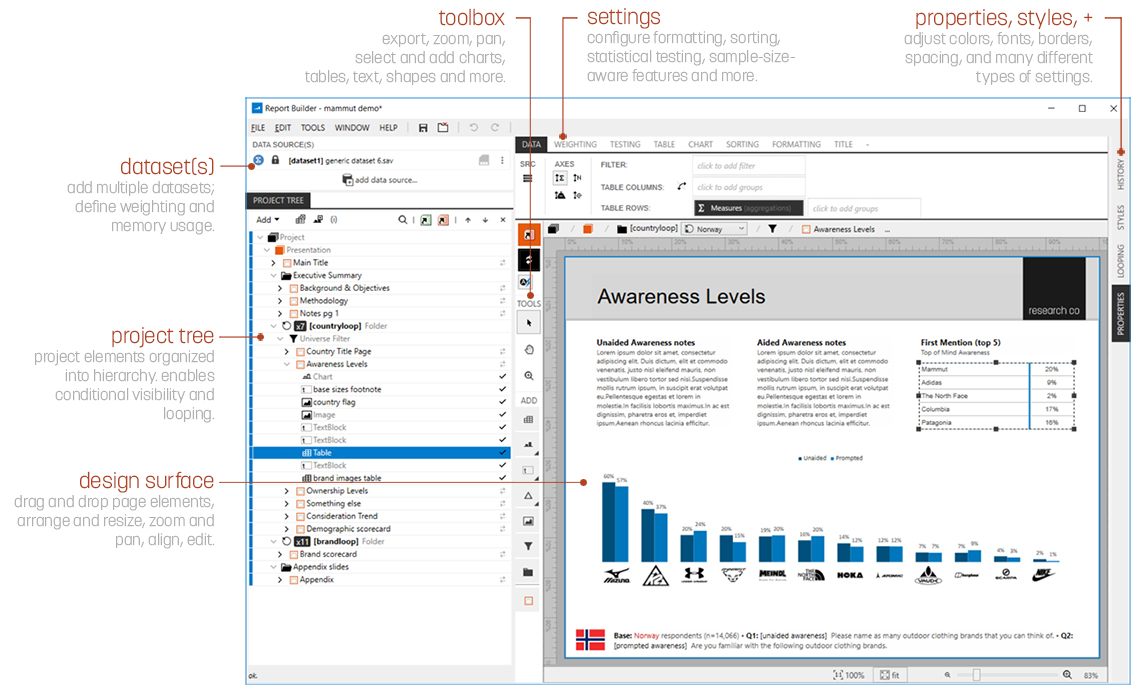
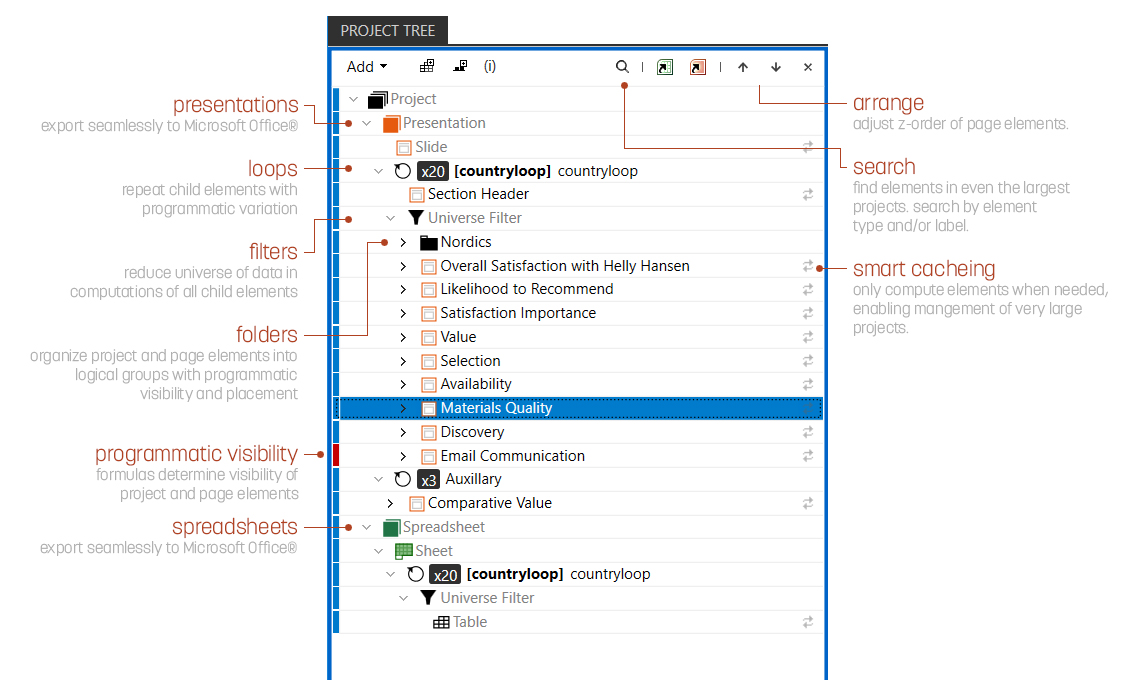
Organize Project
Categorize, arrange, maintain, navigate, collapse, search.
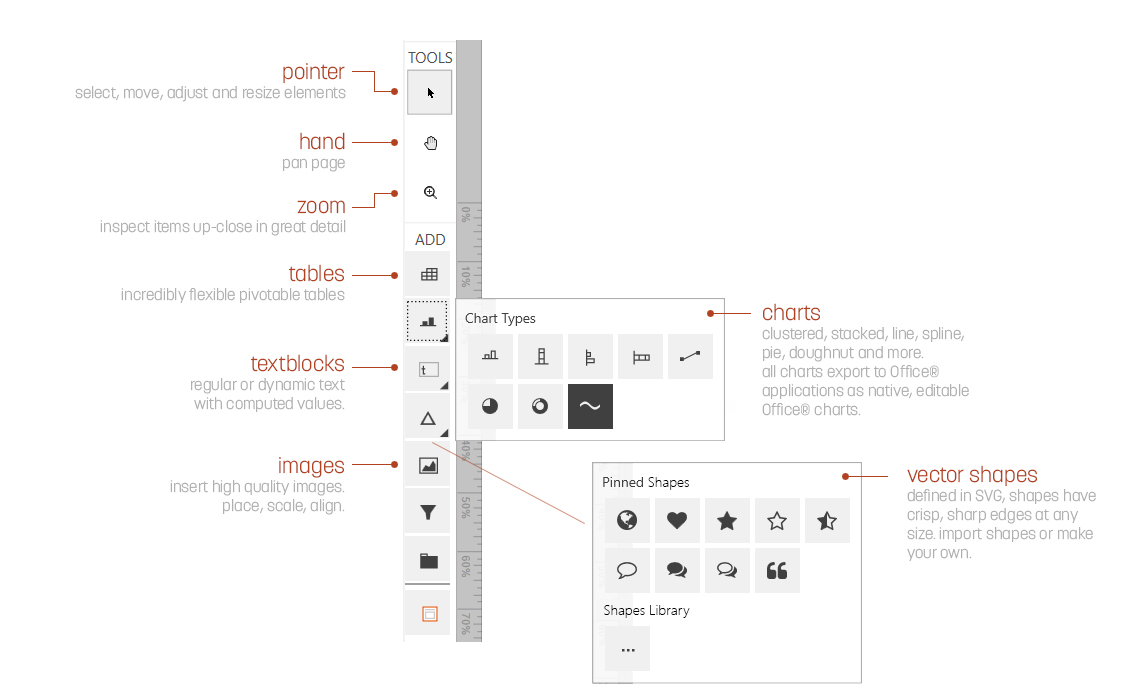
Create Infographics
Add data-driven items to design surface.
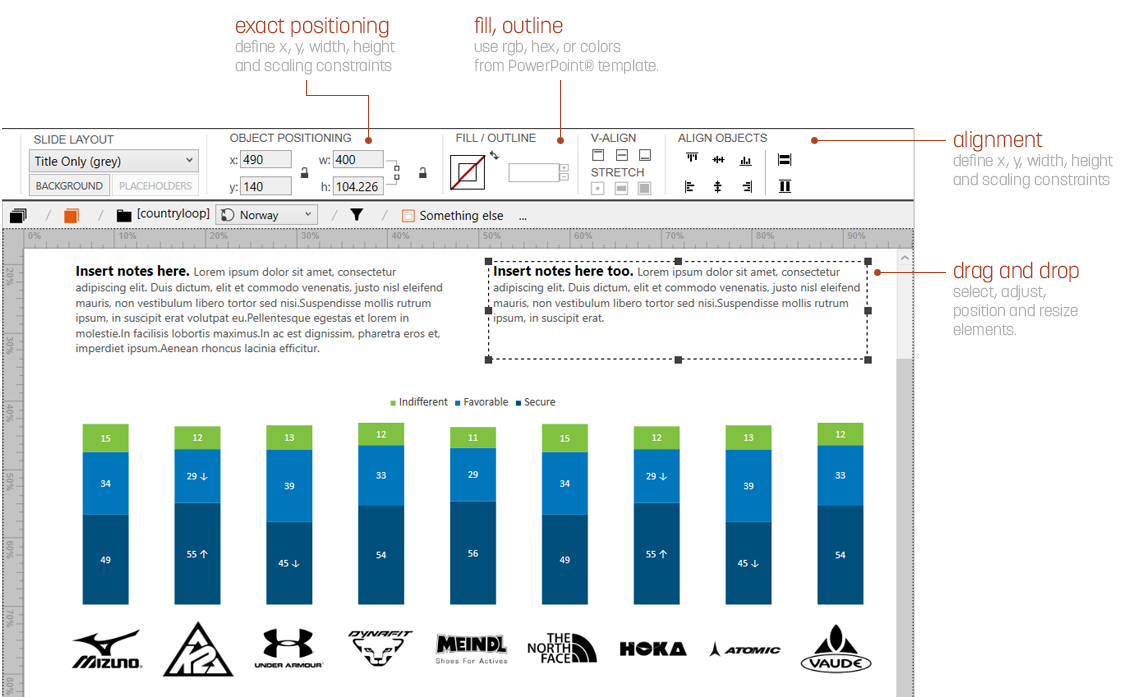
Design with Precision
Position, align and precisely configure.
Features Include
- Office Integration
- Office-native editable charts
- Office-native vector-based tables
- Powerpoint templates & placholders
- Dynamic slide headers and footnotes
- Excel page breaks and print margins
- Hyperlinked table of contents
-
- Statistical Testing
- Independent z-tests, t-tests, & more.
- Benchmarking
- Trend testing
- Testing in charts
- Custom indicators: markers & symbols
- Testing in tables
- Graphical Components
- Dynamic, computed text
- Customizable text markup
- Infographics
- Shapes
- Background colors, images
-
- Editing
- Rulers
- Alignment buttons
- Precise positioning
- Snapping to guides and gridlines
- Multi-edit for all objects
- Searchable project tree
- Working with Data
- Rollups
- Re-basing (without creating new vars)
- Macros (repeat common rollups, etc.)
- Custom syntax
- Limiting (show top n sorted items)
- Pin items when sorting
- Cell hover to show sample size, etc.
- Hover to view stat test formula details
- Option-order multi-response
- Mention-order multi-response
- Scale matrix features
- Net Promoter Score
- Robust Weighting
- Low sample size indication
- Working with Labels
- Templates for dynamic labels
- Keywords (e.g., [var] [syntax] [value])
- Awesome label trimming rules
- Auto-trimming
- Single, consolidated or multi-edit
- N-sizes in labels e.g., (n=1,345)
-
- Looping
- Loop a single slide
- Loop a group of slides
- Loop any object
- Nested looping
- Instance-specific rules
-
For more information, check out these videos and articles.
