Option Order
0
0
Edited Aug 31, 2015
Suppose a questionnaire contained the following question:
Y25. Which of the following areas failed to meet your expectations? (select all that apply)
And suppose the data are coded into 22 variables, one for each option.
figure 1.1
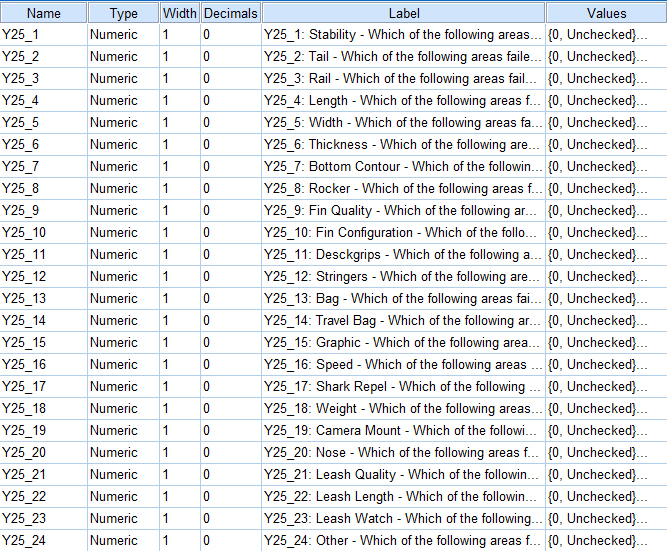
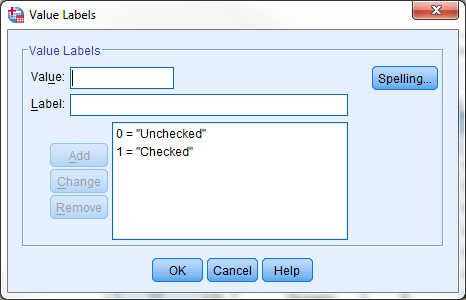
Each variable has only two options: checked, unchecked, (or missing).
figure 1.2
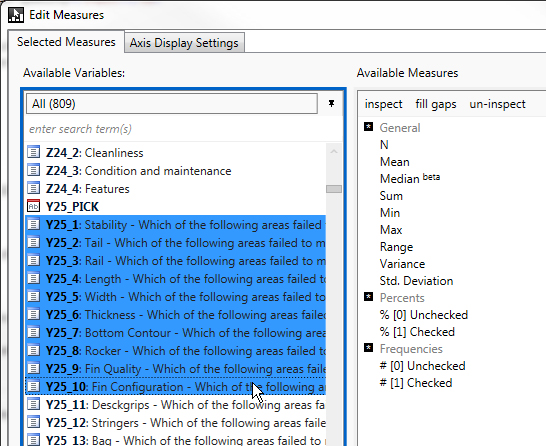
In Report Builder, to compute the percent of respondents that checked a certain option, do the following...
In the Edit Measures window, select one or more variables on the left.
figure 1.3
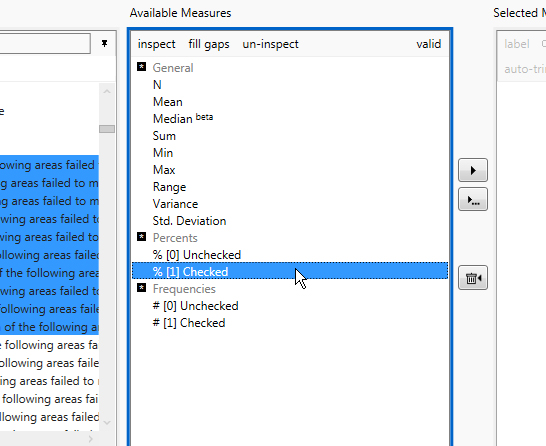
Next select '% Checked' in the Available Measures list. (You may need to click 'Inspect' if you don't see an option for Checked. Checked will only appear if the data file contains a value label for it).
figure 1.4
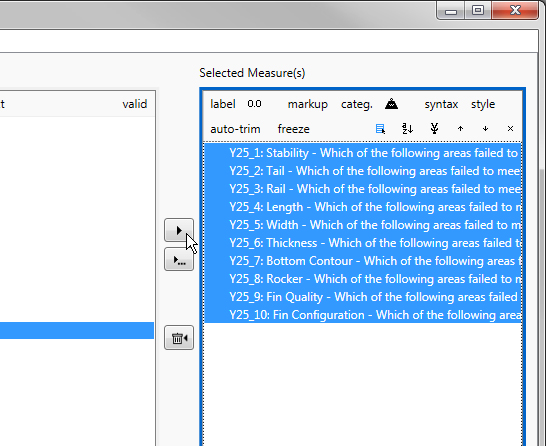
Then click the right arrow button. This creates the measures, one for each option.
figure 1.5
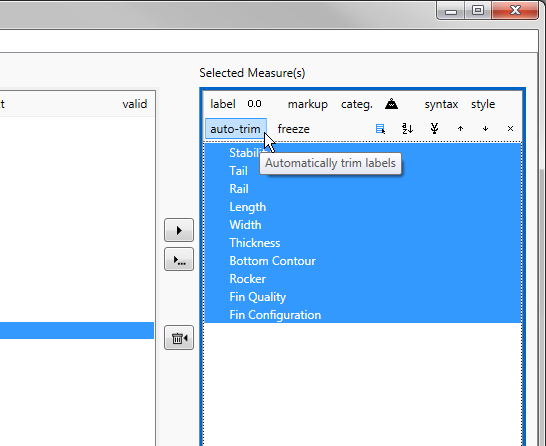
You may wish to click 'autotrim' to attempt to automatically clean up the labels.
figure 1.6
The output table will appear as follows:
figure 1.7
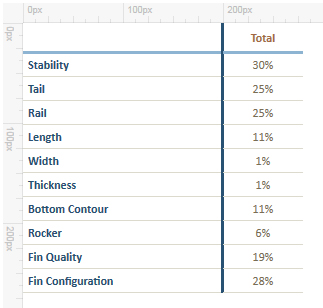
The above method works for both Percentages (as shown) and Frequencies.
